The effects of the recent and still ongoing pandemic have been manifested in several ways across the UK. Many have left us and those surviving have been witnessing an incredible time.
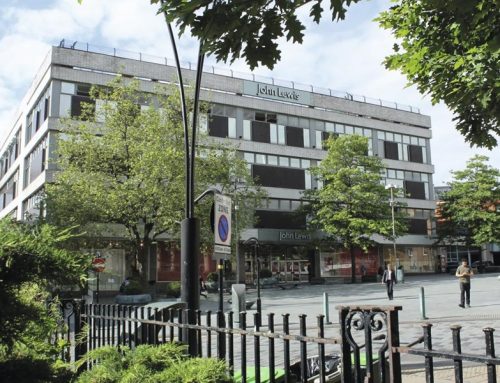
Deserted streets on a Monday morning does not only signify the sudden stop of most (if not all) activities, but is also a measure of how quickly and effectively local and national authorities managed to spread the message.
The initial caution, coming in the form of advice to the population, was rapidly surpassed by a sudden lock-down legislation in the week commencing 21st March 2020. The empty high street became no different to other European countries, who had adopted this severe measure weeks ahead.
During the predicted 12 week lockdown, however, the population showed signs of fatigue in coping with the new lifestyle and we could all observe the dance played out by the public and the authorities, each moving their steps in alternated ways towards the end of the lockdown ballroom.
Who was leading and who was carried through this dance? Was the fatigue of the public the first step, or a well timed release strategy that brought our level of economic activity back, at least in part, to what it was in February?
Tracking traffic levels in Sheffield
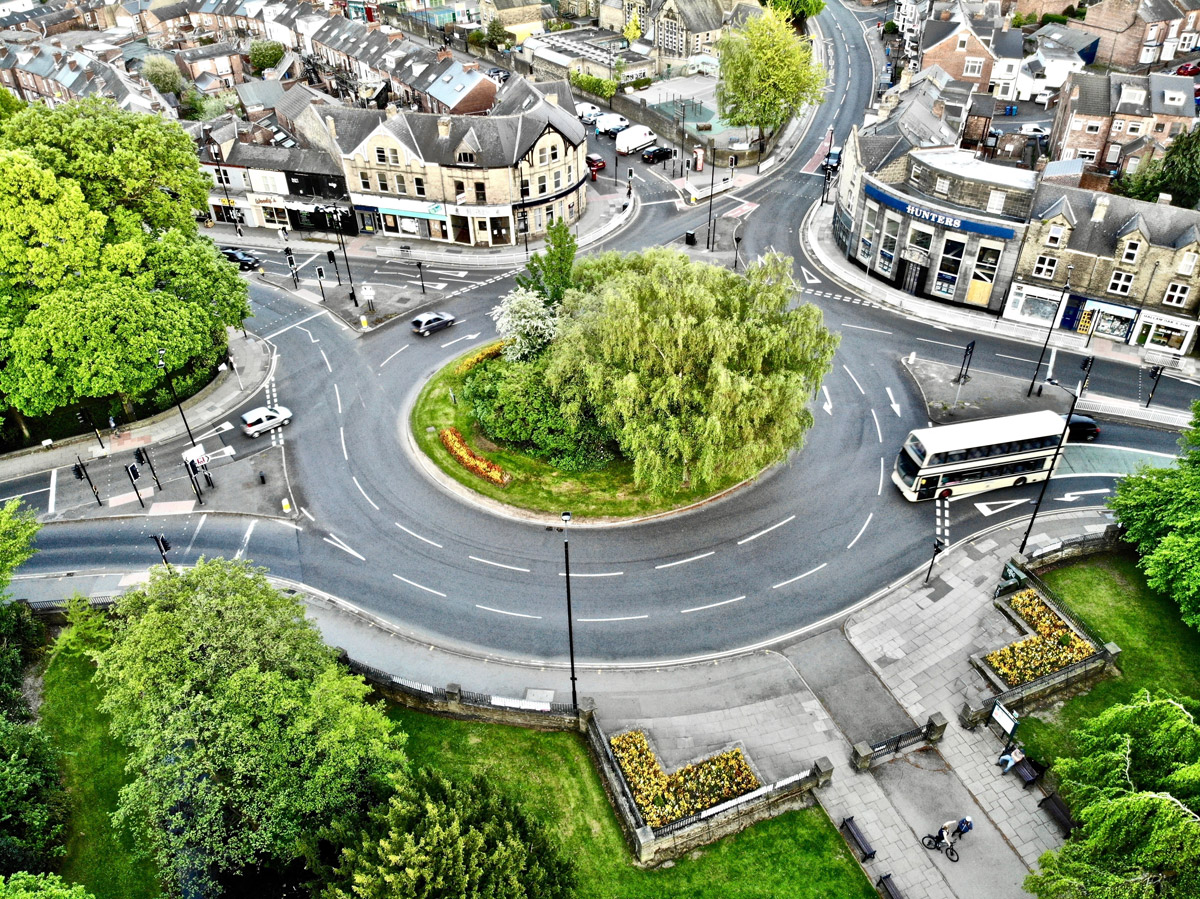
Road traffic is a fine proxy for economic activity and, while for a direct look onto economic activities we may need to wait for data on monetary transactions, for the traffic, we can enjoy real time coverage.
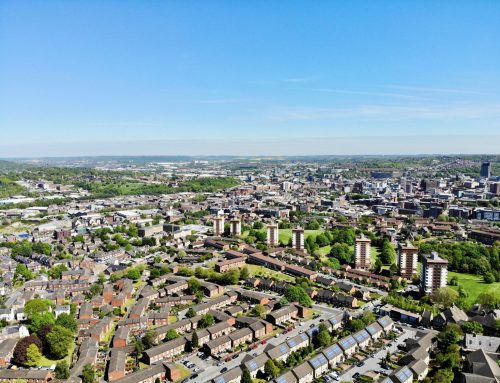
The Urban Flows Observatory, in collaboration with Sheffield City Council, tracks the traffic evolution in the city of Sheffield through a network of 600+ sensors, mostly immersed in the road surface, and often invisible.
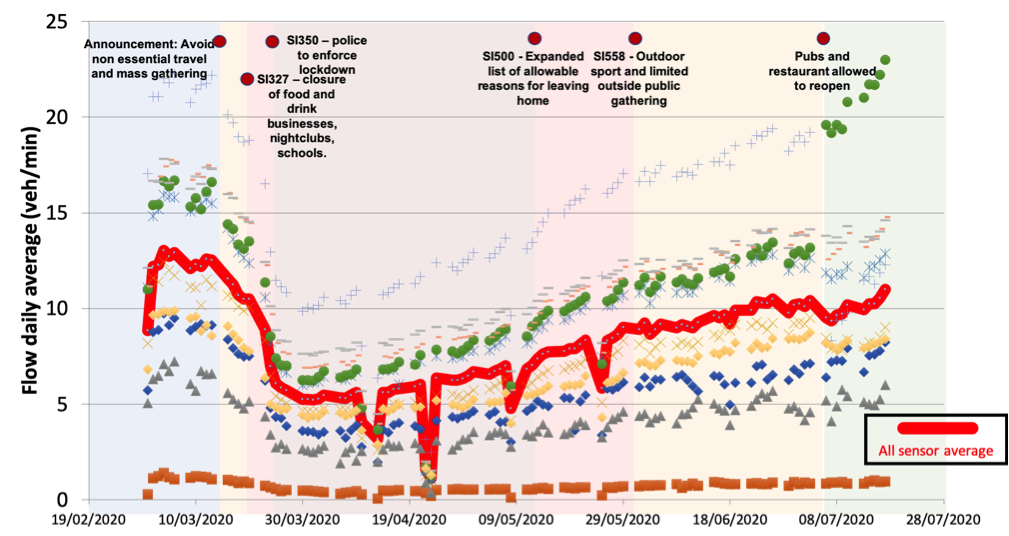
The data from 10 of these sensors located in the city centre tell us that the traffic levels at the end of July are back to 80% of what they used to be, and this is a very good indicator of how much our life has bounced back since March 23rd.
Even more importantly, this data can tell us who took the first steps and by how much, in the dance between the public and the authorities. For example, it is immediately clear that the activities of which traffic is a proxy, in the run to the 26th of March, gradually ground to an almost complete stop.
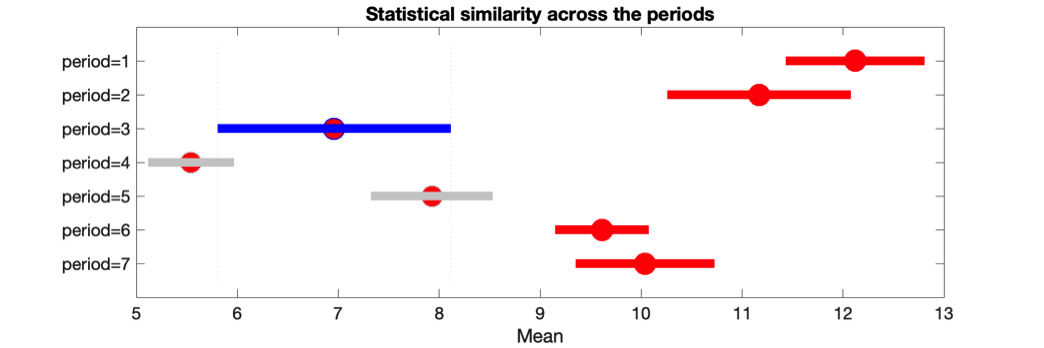
An ANalysis Of VAriance (ANOVA) comparing the means across all sensors in the different periods highlights how the time of strict lockdown was not statistically well separated from the preceding and the subsequent one (periods 3, 4, and 5 in blue and grey). Likewise, the return to a high level of activity was characterised by a continuous relaxation, rather than a process in stage with a large overlap between periods 6 and 7.
Remobilising Sheffield
How effective has the government advice been in restarting the activities in Sheffield? To rank them, analyst often use a Pareto analysis, where events are not sorted by the time in which they happened, but by the effect they had to achieve some target, in our case, the re-mobilisation of the city.
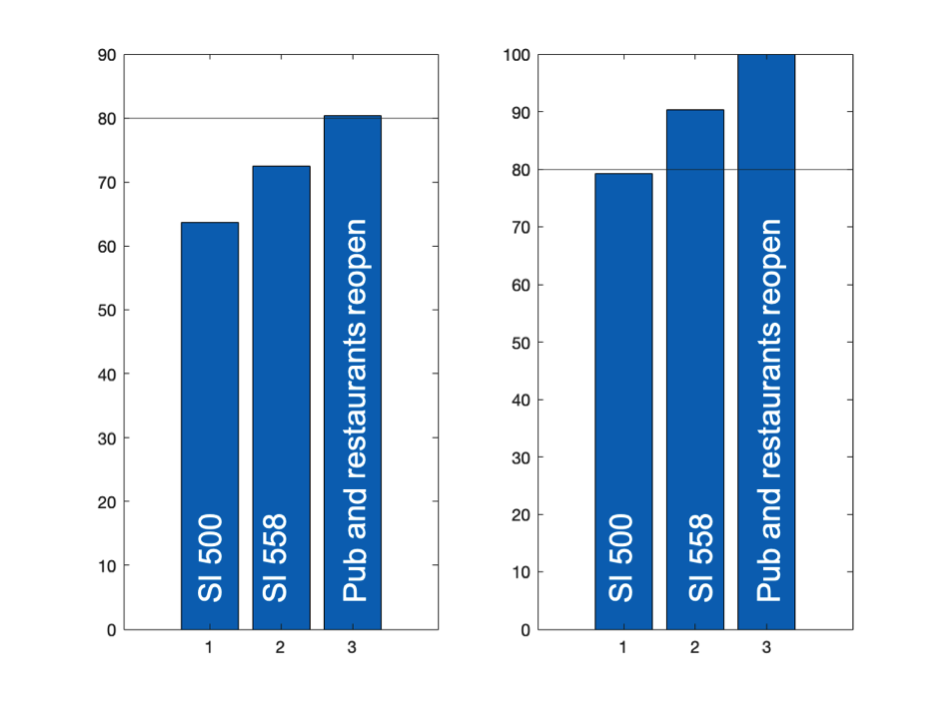
The Pareto analysis in this case would rank the release measures in chronological order, meaning that the largest contribution to the restart of the activities was provided through the SL 500, which extended the reasons for which it was acceptable to leave the place of residence.
The Pareto analysis tells us something else. At the time the SL 500 was published, the traffic, which is our proxy for the activity in the city, was already beyond 60% of what it was in February (left panel) and 80% of its value at the end of July (right panel).
So, who led this dance? Was the legislator driving the action of the public or the public suggesting the next move to the legislator? We shall probably never know for sure but the evidence suggests that the dancers were a very good match.
About the authors
Oskar Ernst is a third year student in Aerospace Engineering at the University of Sheffield, interested in data science and the analysis of large datasets.
Giuliano Punzo is a Lecturer in the department of Automatic Control and Systems Engineering and leads the transport theme within the Urban Flow Ob