This blog post is a condensed version of the original paper published in the Wiley Online Library Journal of Industrial Ecology on 25th September 2021. Find out more about the Journal and read the full paper, including all references, here.
Abstract
Building stocks represent an extensive reservoir of secondary resources. However, common stock characterisation methods are still not suitable to adequately inform circular economic strategies. These approaches typically result in a loss of building-specific details, with results expressed in terms of material mass, e.g. glass, rather than component, e.g. window.
To deliver a higher resolution of detail, a scalable approach to urban stock characterisation that enables an estimation of building stocks at the building component level is needed. In this paper, we present a framework to automate such characterisation of urban building stocks.
The Importance of Built Environment Stocks in Meeting the UK’s Net-Zero Emission Ambition
The Paris Agreement is an attempt between 189 nations to avoid global temperature rises of over 2°C, but progress has stalled. Achieving this climate goal will require radical action across nations, cities, and sectors. In the UK, meeting the country’s new net-zero emissions ambition by 2050 will be a considerable challenge that requires urgent action. The built environment, which accounts for 20% to 40% of emissions, is a key sector to decarbonise. Two critical areas must be tackled: embodied carbon emissions (i.e., emissions from e.g. the manufacture and transport of building components), and operational emissions.
A shift to a circular economy, which aims at reducing long-term material consumption, would assist in lowering the embodied carbon of the building environment. But a circular economy can only be delivered if material stocks and building components already in-use are characterised in sufficient detail. These secondary stocks of materials, also known as anthropogenic stocks (i.e., human-made), have undergone a 23-fold increase and are still on the rise. They represent a key opportunity for resource recovery through circular economic strategies, especially in urban areas, which are characterised by a dense accumulation of built environment stocks.
Material stock and flow accounting can assist in predicting future material demand based on the current stock age and likely replacement rates. This is especially important for those nations with older building stocks, such as the UK, where 85% of the building stock which will exist in 2050 is predicted to have already been built. This also means that operational impacts need to be reduced through energy retrofit of the existing stock. Thus, the more we understand about this stock, the better it can be maintained and mined in the future.
Delivering the Circular Economy
For the circular economy, the building stock has proved to be a critical part of the built environment as it hosts a wide variety of easy-to-access and easy-to-recover materials above the ground.
The implementation of a circular economy faces a number of challenges industry wide:
- a limited awareness across the supply chain
- concerns about the consistency of flows of returned goods
- an unclear market demand for secondary resources
Overcoming such barriers requires highly detailed modelling of building stocks so that stakeholders throughout the supply chain can obtain the exact quantity and quality of secondary resources that would be recoverable from a specific building nearing demolition. To enable this, estimates of material quantity and quality need to be spatially explicit and be measured at a building level.
Two approaches can be used to calculate the amount of material stocked in a specific geographical area. The top-down approach, which relies on mass balance and lifetime distributions, allows to model the accumulation of stocks over time, but does not inform on the refined spatial distribution of these materials, nor on the exact products in which these materials are stocked. In contrast, the bottom-up approach counts a given stock piece by piece, thus allowing for results differentiated in terms of materials and stock composition. Although time intensive, the bottom-up approach is preferred when generating detailed information on the physical arrangement of the system under study.
However, when applied to buildings, the bottom-up approach often requires the use of archetype buildings, i.e. typical types of buildings. These archetypes are a way to homogenise the otherwise highly heterogeneous datasets that are building inventory. By categorising buildings into typical construction type, construction period, and/or use, the building inventory data becomes a more manageable dataset of a few building archetypes, thus making the study possible to conduct. But this archetype classification of buildings results in a loss of building-specific details that are crucial to circular economic strategies.
Another shortcoming of common bottom-up modelling of building stocks for circular economy is the quantification of stocks in terms of materials mass rather than building components. In a circular economic paradigm, component reuse is always preferable to material recycling. Component-level information is critical when aiming to estimate the circular economic potential of a building stock. The number of windows shows the potential for future replacement, remanufacturing, and reuse, whereas mass of glass only shows the scope for recycling. Achieving a truly high-resolution stock characterisation would require inspection of individual stock buildings. Undertaking such inspections across whole cities can be prohibitively time intensive using current approaches.
The more recent uses of remote sensing can and has, to some extent, mitigated some of these associated problems. These, however, are still limited, especially with respect to components at a building level. Current archetype-based approaches to stock accounting require increasingly more detailed archetypes to increase precision of the results. This inherently poses a data collection challenge and raises the level of uncertainty at building level. Barring a few choice countries, including Denmark and Germany, such inventories, or data required to simply assemble them, do not readily exist in many others.
Building-specific characterisation for a stock of millions in any given city or region is an enormous challenge. There is a need for a scalable approach to urban stock characterisation that enables a bottom-up accounting of stock at component level.
Achieving a Scalable Framework
We propose a framework integrating mobile-sensing approaches and workflow automation in urban stock modelling to start addressing the scalability in stocks characterisation. Scalability of an approach is measured as the extent to which it can be repeatedly extended to handle increasing workload with an optimised cost-effectiveness and without additional resource penalties. The methods by which we characterise stocks would need to become both faster at a building level and more efficient at a city/country level. The use of mobile/remote-sensing, computer vision, and deep learning methods are likely candidates to achieve scalability.
As the overall framework in Figure 1 illustrates, a mobile-sensing approach with computer vision and machine learning to construct 3D urban surface maps would allow us to identify and classify stock objects, components, and materials specific to individual buildings. The framework consists of an initial data collection stage using a confederation of sensors. A suite of machine learning and computer vision approaches are then used to both reconstruct the 3D geometry of the urban scene and detect stock components and materials. Finally, the 3D reconstruction and detected components/materials are fused to generate a semantically labeled urban model that enables quantification of the stock components and material at a building level.
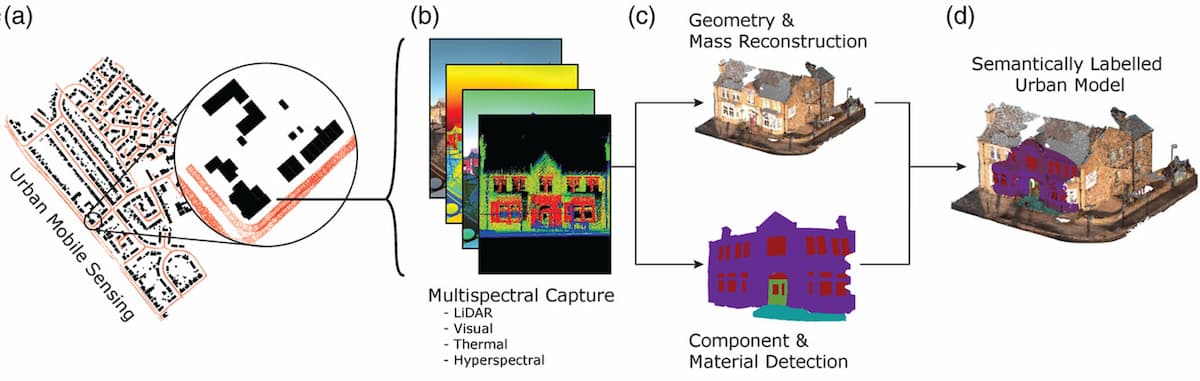
Figure 1 – Framework schematic for a scalable spatially explicit and high-resolution urban stock characterisation using multi-sensor mobile mapping (a, b) to enable reconstruction of building geometry and detection of components and materials (c, d) for a semantically labelled urban surface model (d)
Our intentions in this work are not to develop/advocate a set of specific computer vision models for the sole purpose of stock accounting. The crux of the proposed framework rests in the argument for the integration of the mobile-sensing and computer vision approaches and use of automation to increase the pace and spatial resolution of stock accounting at a building/component level.
The data streams suggested in the figure are informed by the existing literature on what currently can and ultimately could be extracted from each sensory capture:
- LiDAR enables accurate measurements of size and geometry of buildings and their facade components
- visual imaging satisfies minimum requirements to detect and recognise the facade components
- and thermal and hyperspectral imaging enable detection of components’ material composition and wear condition.
Practical Obstacles and Policy Implications
The implementation of such a framework could experience some practical obstacles and/or policy implications. The main and immediate obstacle is ensuring a line-of-sight with buildings when using mobile-sensing approaches for data collection. For a complete implementation, the data captured would need to have full building coverage. Using only drive-by methods, for example, Google Street View or the case study in the next section, will result in quantifying only what the vehicle can observe from the street, leaving out the façade components that would generally be expected to be on the backside of the buildings or those on the front that are obstructed by vegetation or miscellaneous urban furniture.
While this does not impact the validity of the information extracted for each building, a mixture of drive-by and fly-by imaging would be required to ensure full building envelope coverage to avoid systemic underestimation of components and stock. Drone-based fly-by building detection approaches are now fairly advanced in reconstructing building geometry from visual images.
Remaining challenges in complementing drive-by methods with fly-by imaging are those relating to swarm dynamics. These would be crucial for scalability in the context of an automated deployment of a number of low-cost unmanned aerial vehicles to achieve the same pace and ease of en masse data collection as drive-by methods.
A secondary group of implications would involve the collection, management, and governance of such integrated and automated mobile/remote-sensing frameworks. In terms of data collection, the proposed framework remains scalable, deployable, and manageable in terms of human effort and time needed to undertake the mobile sensing and maintaining the stock model. This inherently suggests potential for a public body or the academic community collectively shouldering computing costs and the management of such urban resources under an opensource open data framework. We should, however, note the high capital costs of developing and deploying a custom imaging vehicle with all four sensory requirements which is currently required for the implementation of the framework through drive-by imaging might limit development opportunities for commercial ventures.
A Continuous Loop of Materials
The circular economy is built on the idea of a continuous loop of materials, across multiple lifecycles, to reduce and eventually eliminate new resource extraction. Critical to the idea is that of maintaining materials at their highest value possible. In the case of the building stock, this would be maintaining materials together as a building in the first instance, meaning that building retrofit is a key part of the agenda. If buildings cannot be made fit for purpose, they should be deconstructed, and the components remanufactured or directly reused. Alternatively, they could be striped back into their component parts and the individual materials reused or more likely in this case recycled.
The eventual full implementation of the framework enables derivation of façade materials quantity and quality. For example, the number of bricks that could be salvaged for reuse, or the mass of concrete available for downcycling. These building-specific observations can then be improved by linking in building archetypes to provide further information on what cannot be seen from the outside.
Addressing the larger decarbonisation challenge involving buildings, a significant proportion of energy use in buildings is to maintain thermal comfort. Heat loss in older buildings is predominantly a function of the thermal performance of the building facade. This is driven by the material characteristics and method of construction. Our suggested framework would also facilitate a scalable identification of the stock most in need of retrofit. This is helpful to both predict future material demand and its carbon impacts, but also enables consideration of whole life carbon payback times for different insulation types and could facilitate local authorities in bulk procuring retrofit interventions.
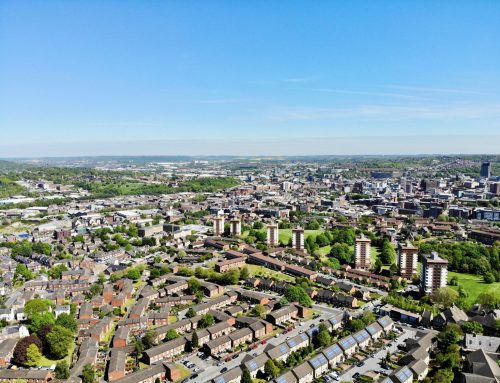
Proof of Concept: A Preliminary Case Study in Sheffield
In this section, we demonstrate the potential of the framework combining mobile sensing and computer vision in a small case study of a small neighbourhood. Using a prototype workflow comprising a custom-made mobile-sensing platform and an existing suite of neural network models, we calculate an estimated count of external doors and windows.
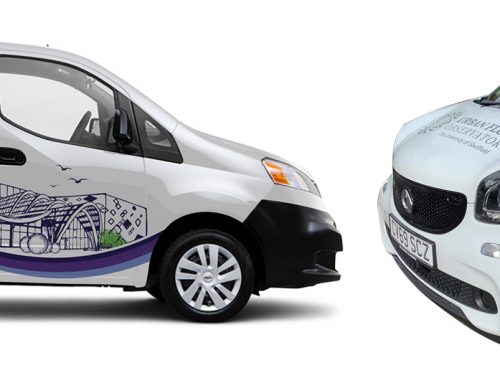
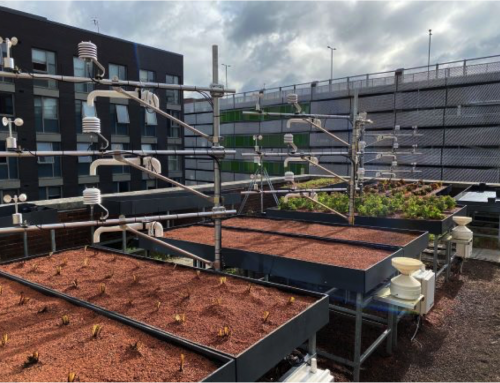
The case study area is of roughly 2500 inhabitants spanning 2.79 km2 in the southwest of Sheffield, UK. The mobile-sensing platform used is a van mounted with a custom imaging rig, which enables collection of the four data streams required in the production of multi-spectral texturised 3D surface maps of the captured built environment. For the case study presented here, we only make use of the visual imaging stream for demonstration purposes.
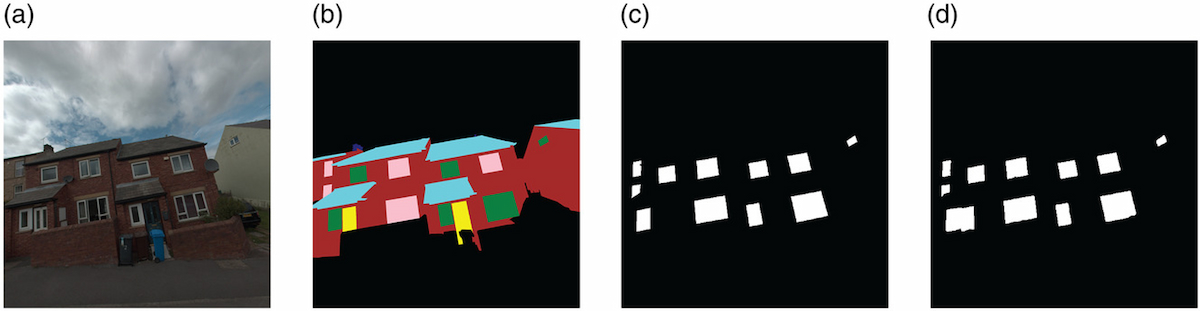
Figure 2 – Sample of visual input to and output of the component segmentation model. (a) Raw image input, (b) sample annotation of façade component used for training, (c) sample window component truth mask isolated from the full annotation, and (d) sample model predicted window mask
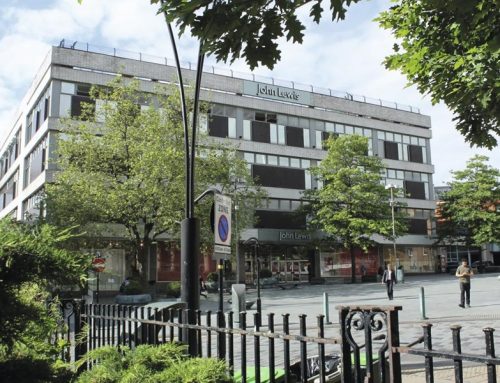
We make use of the model developed by Dai et al. (2019) for this case study for convenience as it has originally been trained on output from the same research vehicle. The images used by Dai et al. are also captured in Sheffield, covering mostly terraced, semi-detached, and detached residential buildings, albeit in a different part of the city without any overlap with the stock used in the case study here.
For the purposes of our case study demonstration, we only use the models to detect and present counts for doors and windows since these are more inherently countable relative to, say, walls and roofs and as such more instructive in a wider discussion of the framework’s practical applications vis-à-vis circular economy and building refurbishments.
Other Data and Methods
The Ordnance Survey maintains and provides building footprint geometry for the UK. These are obtained through a combination of aerial LiDAR and photographic imaging. The dataset, as such, includes building height as well as footprint geometry. Given that the focus of this paper is showcasing the potentials of a mobile and remote-sensing framework, we use this dataset here, as Ordnance Survey already provides the product.
In order to obtain estimates of the count of façade windows and doors for each building, we first extract the 100 nearest vehicle positions to the building centroid, and hence images taken looking in the building’s direction. The retrieved image positions and the distribution of average image distance from buildings can be seen in Figure 3a and its inset. Overall, we consider 42,451 unique photos for 1515 structural footprints within the neighbourhood. The retrieved photos are then passed to the image segmentation models to extract the number of door and window components for each image. This results in distributions, each effectively based on a hundred sampled values of the count of doors and windows for each building. Since the field-of-view in each image is not limited to a single building, we scale the component count in each image by the number of buildings for which a given image has been retrieved and weigh them inversely with distance from the building.
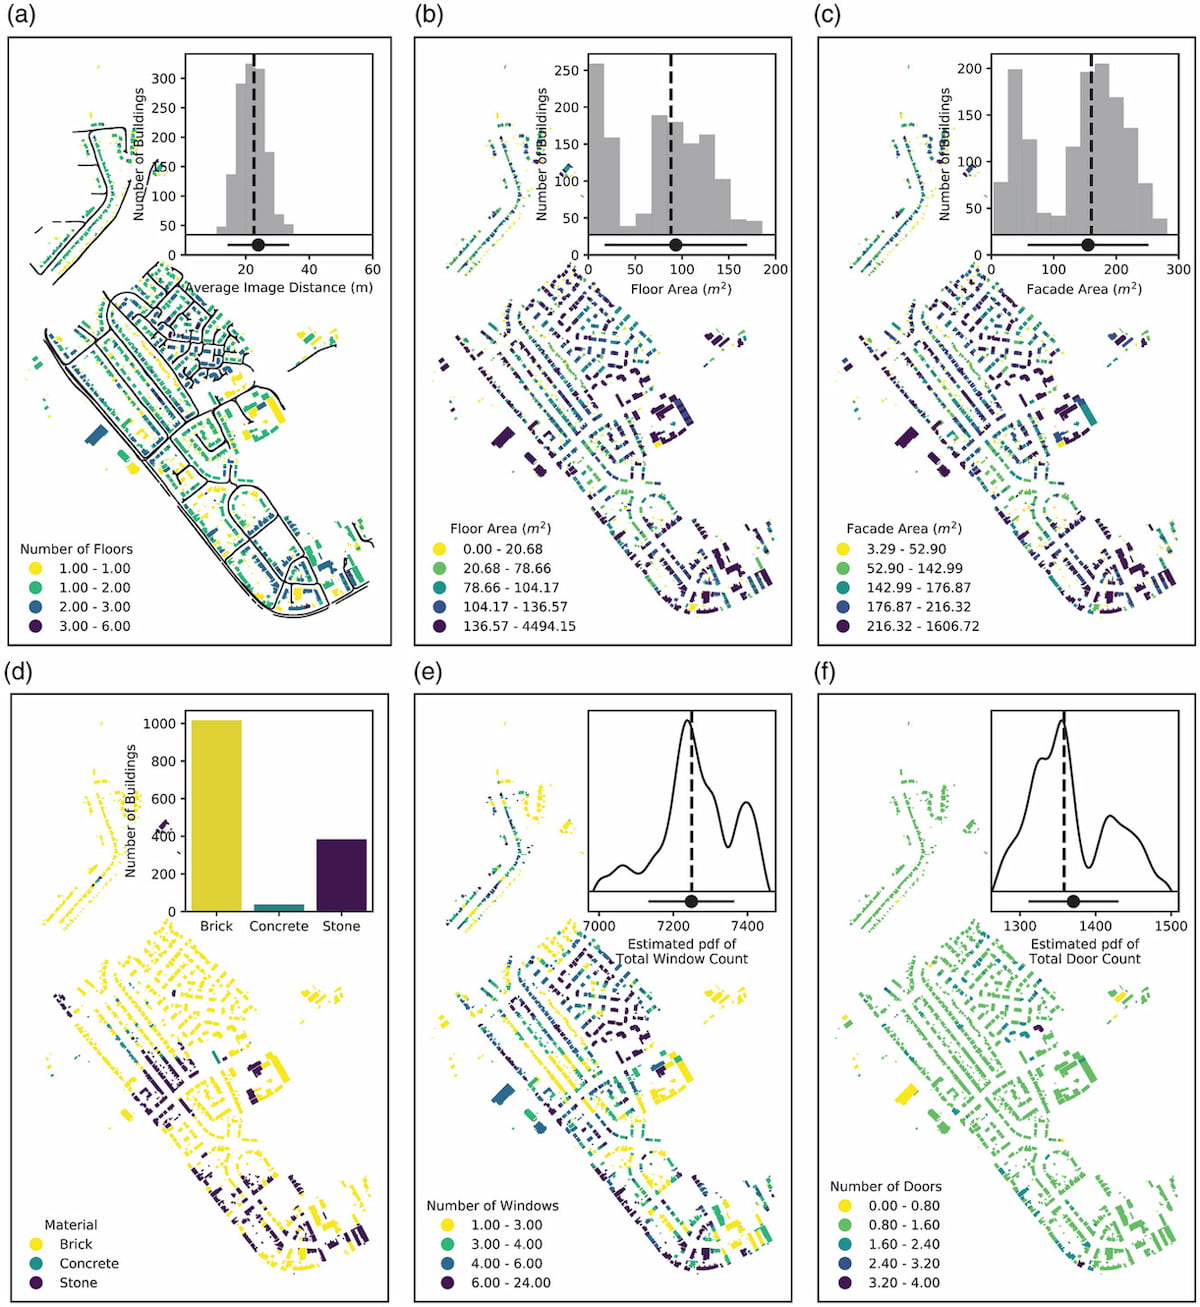
Figure 3 – Spatial distribution of building characteristics and components. (a) Colormap of floor count along with the positions of the vehicle corresponding to the 42451 images. (b) Total floor area. (c) Façade area as estimated by height and footprint perimeter. (d) Predominant façade material. (e, f) Estimated numbers of windows and doors with insets showing the estimated probability density function of the expected value for the total neighborhood-wide count. For insets, dashed vertical lines denote the median with the point plots indicating mean and standard deviation. Note that colormap breaks are of different scales. Maps contain OS Map data © Crown copyright and database rights 2020. Data from this figure are available in File S2 of the Supporting Information
We use Gaussian kernel estimates of the distributions of the doors and windows for each building in estimating the probability distribution of total number of components in the neighbourhood.
Building Components and Materials
Figure 3 shows the spatial distribution of the stock information extracted from the footprint, height, and mobile-sensing platform. The neighbourhood is mostly made up of single or double story terraced and semi-detached houses with a handful of medium-rise apartment blocks, Figure 3a. Figures 3b and 3c show the distributions of building floor and façade areas. The bi-modal appearance of these is due to the inclusion of garages and temporary structures which comprise the peaks at the lower values. The rest of the buildings show an average floor and façade area of 100 and 150 m2, respectively. Assuming an average wall thickness of 300 mm, the mean neighbourhood floor area would be reduced to 90 m2, which is in broad agreement with the national average usable floor area of 92 m2 cited in the English Housing Survey for buildings of a similar age. Figure 3d provides a breakdown of the prominent façade material, see accuracy and sensitivity section for more details. Finally, Figures 3e and 3f and their insets show spatial distribution of the façade components and their total count across the neighbourhood, respectively.
There is, expectedly, a wider variation of component count for windows at a building level than doors. For the majority of buildings in the neighbourhood, we detect a single door which is consistent with the number of doors visible on the façade of terraced and semi-detached houses to a street-level observer. (Note that in Figure 3f, the higher number of doors is often observed for corner structures where a better line-of-sight to buildings’ back doors is available.) As for windows, the detected number of street-facing windows closely follows the building type, where rows of terraced and semi-detached buildings can be seen with two to five windows, respectively, with the higher window counts observed in clusters belonging to apartments and non-residential buildings.
In the full paper we have also briefly addressed some aspects of the prototype’s accuracy and sensitivity.
Future Work
In practical terms, one of the options for optimal circular economy is building refurbishments. This would reduce the demand for new buildings, reducing embodied impacts. However, there is a risk that if energy efficiency is not a priority, building life extension could maintain operational inefficiencies making carbon emissions from use more challenging to reduce.
In building refurbishments terms, the case study presented would only be able to give a crude estimate of likely insulation and does not consider the nuances of different wall types, further work is therefore required to investigate the use of the mobile-sensing platform for the recognition of wall construction from their visual, thermal, and hyperspectral signatures. This would facilitate estimation of the surface areas that require either external or internal insulation, compared to cavity wall properties which may have already been insulated.
Future work also needs to make more targeted use of thermal and hyperspectral imaging to understand heat loss patterns through the building fabric for a quantification of component material type and quality.
Finally, parallel work is under way at the time of writing this article, focusing on classifying buildings into archetypes for the UK, something that is currently lacking in a specialised sense for the UK building stock. This will be valuable, and we aim to integrate these archetypes within the framework.
Conclusions
In this paper we have demonstrated the application of a framework based on mobile sensing and machine learning to automate the estimation of building stock components and materials. This represents an advance on existing bottom-up accounting of building stocks that rely entirely on archetypes.
The semantic reconstruction of the built environment in 3D would offer multiple benefits. First, accounting exercises based on such a framework provide building-specific registers of components. At its bare minimum, mobile sensing provides high-fidelity individualised measurement of buildings. Given access to relevant archetypes for an area, the framework can also provide a spatially explicit archetype matching method that provides the same level of information as archetypal average characteristic estimates. Fully functioning, however, the framework enables building-level detection of various facade components and their material, for example, windows and wall, and an understanding of both what is available to urban mine in the future based on building-level measurements, as well as indicating likely future material demands for building refurbishments.
Additionally, the combined building-specific information on components, their dimensions, and constituting material allow for a much more accurate and spatially resolute quantification of material stock which is currently partially achieved through remote sensed information.
—
Authors:
Hadi Arbabi, Maud Lanau, Xinyi Li, Gregory Meyers, Menglin Dai, Martin Mayfield, Danielle Densley Tingley