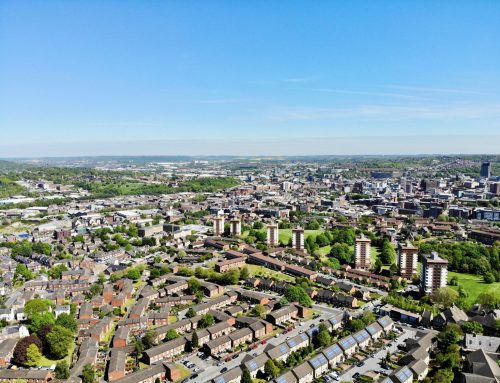
A key priority of the Urban Flows Observatory is understanding the flow of energy and resources in Sheffield – and the impact that our use of these has on the environment, economy and wider society. The makeup of our cities, where, and what transport infrastructure is in place, can have a huge influence on these factors. In this blog we take a deep dive into the links between transport and productivity, and how infrastructure interventions could help us build healthy, happy and productive cities.
Transport and Productivity
In March 2015, the report on the Northern Transport Strategy, the Northern Powerhouse, was delivered, seeking to rebalance the country’s regional divide.[1] More recently, Highways England announced a £300,000 study to look at improvements to the road links ostensibly linking the Preston and Leeds Travel to Work Areas (TTWA). The study, as Transport Secretary Chris Grayling put it,
“… is part of our ongoing work to ensure the routes between Lancashire and Yorkshire are fit for the future – helping link communities better and boosting the economy to supercharge the Northern Powerhouse.” [2]
The announcement makes reference to the importance of the East Lancashire-Yorkshire corridor to the freight traffic of the industries in the area. As with the original plans, this latest announcement and its choice of cities and regions to be connected, be it via road or rail, can appear arbitrary at times, and the growth and agglomeration-related language raises a few questions.
Bigger is Better?
In simple terms, we tend to believe bigger cities are more efficient with their resources and more productive economically.[3] This comes from the ability of cities to facilitate and maximise interactions between people ‘boosting the economy’, such that the per capita output increases with the population. As far as transport strategy is concerned, this is largely why the efforts aimed at balancing the economic performance gap between the North and the Southeast have focused on connecting major urban centres in the North. The inter-city transport links are seen as a way of rivalling the size, productivity and efficiency London, by constructing a virtual city in the North.
The question is, how do we decide whether a city’s underperformance is in fact due to mobility and transport problems and thus which cities can benefit from such transport schemes?
Agglomeration-based Infrastructure Intervention
An urban agglomeration can be defined as an extended city(s) or town area(s) made up of the built-up central place(s) plus any continuously linked suburbs. There is always more to the perceived powers of urban agglomeration than meets the eye.
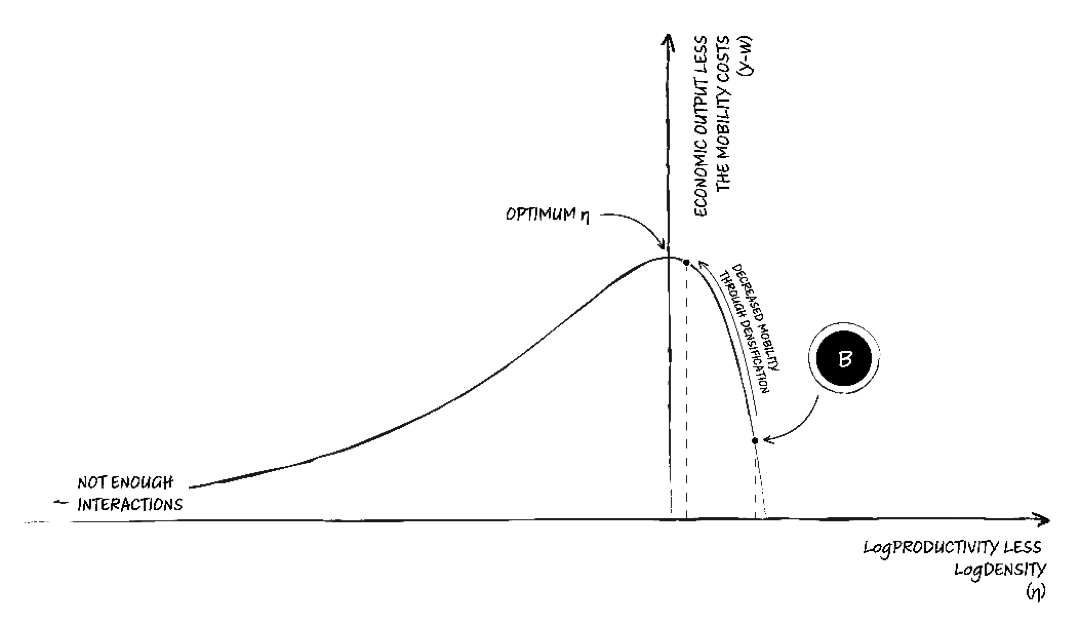
Let’s look at cities belonging to a given urban system – say that of the UK – from a theoretical perspective. We would expect to see a balance between the cities’ economic output and what they pay in terms of the costs of transporting people about in the city to enable those economic returns – a size-cost balance if you will.[4] As a function of the cities’ density and productivity, this size-cost balance would look something like this.
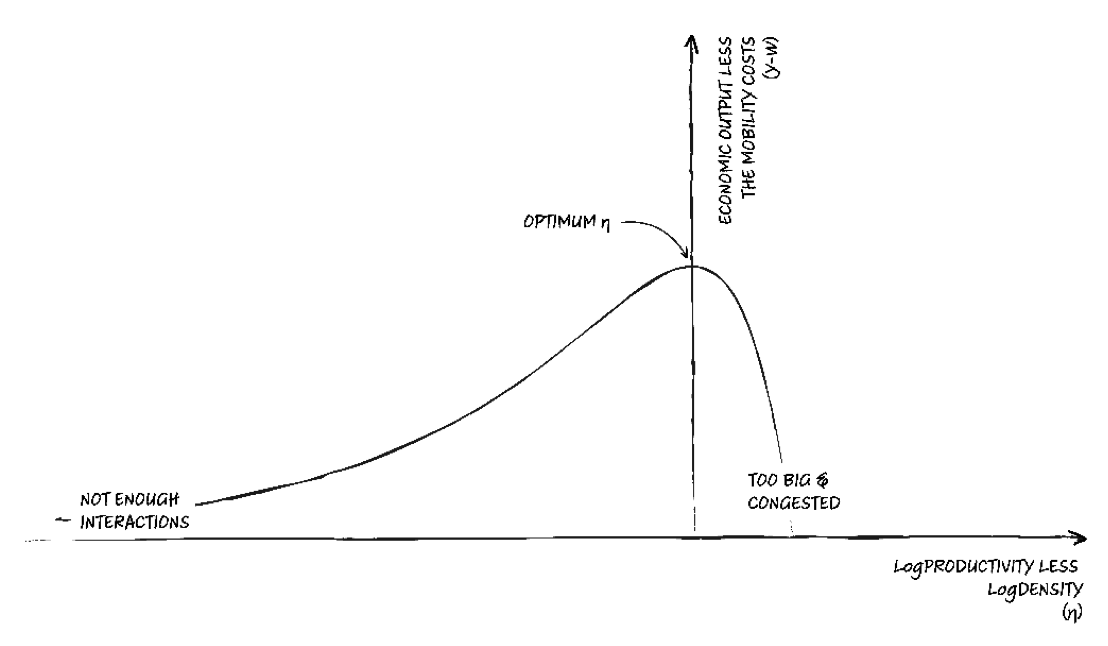
We would expect our cities to have evolved over time – think many decades or more – so that they are, more or less, scattered over the 𝑌−𝑊 curve around that point of optimum 𝜂. What is of more interest, is the type of infrastructural/planning intervention a city would then need to get closer to the optimum 𝜂, if they happen to be a long way to either side of it.
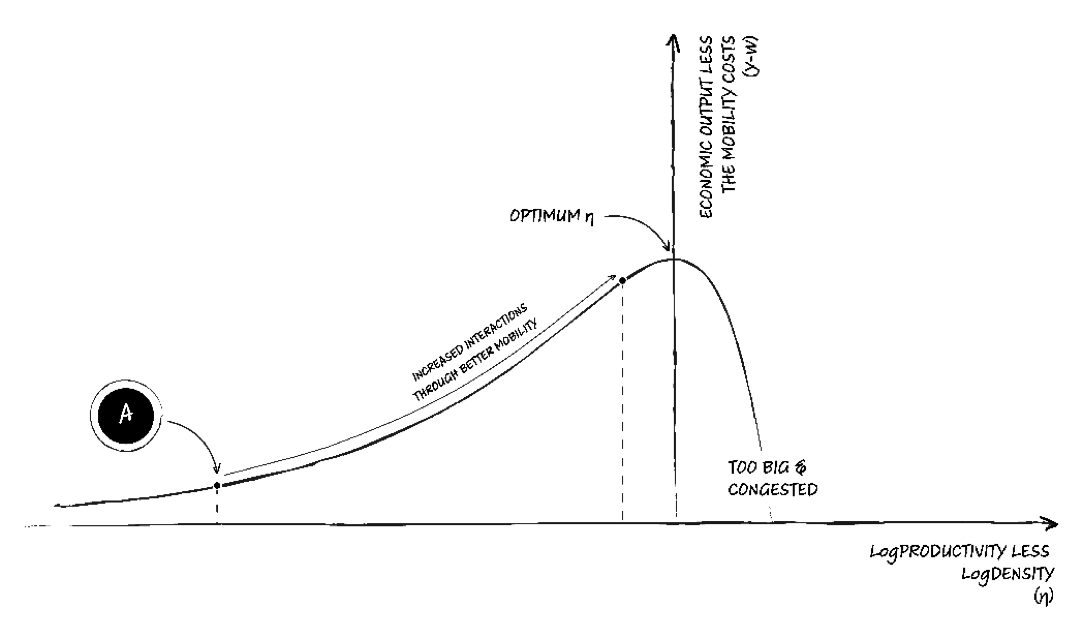
For cities that are located to the left of the optimum 𝜂, they suffer from insufficient interactions internally. These are cities that are not meeting their potential because the population do not enjoy adequate internal mobility. Climbing the hill from the left would then require addressing intra-city accessibility and providing better intra-city transit systems.
The cities on the other side of the hill, to the right, have usually grown too large because of their economic success, resulting in an escalation of mobility costs. To minimise the mobility tolls while maintaining social interaction levels, these cities would benefit from facilitating shorter-distance interactions more efficiently. This could come from making the built area more dense and compact.
Why Do We Need More Urban Data?
When examining the infrastructure needs of cities in the UK from this perspective, we see a systematic abundance of cities to the left of the performance curve. These are cities in need of better internal mobility and accessibility.[5]
The boundaries on the maps below are drawn at adjoining patches of over 1400 persons per square kilometre, portraying dense city-centres, to those with only 100 persons per square kilometre, partitioning larger multi-centric regions.
Looking at city units across the various spatial scales, we can reframe the North-South performance divide as one of inadequate internal mobility across the North.
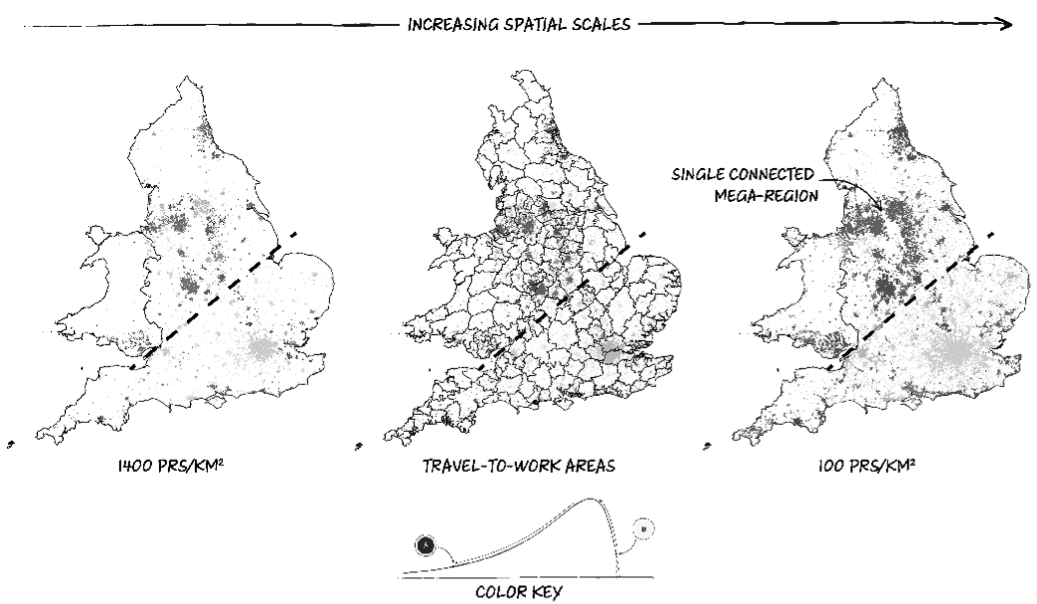
The key takeaway from these maps is the observation that many northern cities – take Sheffield as a typical case in point – indicate an inadequacy in their internal mobility and accessibility, regardless of the spatial scales at which their boundaries are drawn.
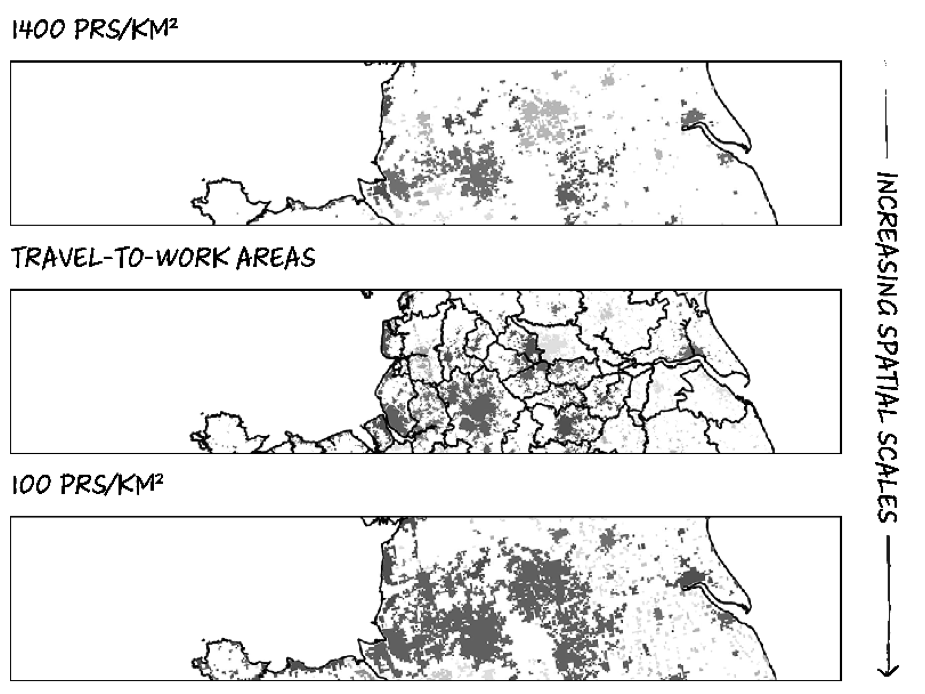
What Sheffield and, indeed, many cities across the North, then need to realise their economic potential is interventions that facilitate social interactions within their boundaries. This spans from individual city centres, to the large urbanised area stretching from Liverpool to Nottingham.
What Shape Should Transport Interventions Take?
The approach we have reviewed lets us identify the infrastructural needs of city units across spatial scales. It can also provide a systematic way of identifying potential intra- and inter-city transport links.[6]
What it does not do, however, is provide an answer to what particular intra-city measures – which road to widen or which services to improve – should be considered. Nor does it provide cost-benefit assessments that would estimate the costs of realistically implementing such transport/densification schemes, versus the economic benefits they might provide.
These remaining questions require a different kind of data, and a lot more of it. To help determine where in a city opportunities for intervention can be found we firstly must decide a feasible set of options based on a system-wide analytical framework. We would then need high-resolution spatially and temporally granular data on traffic flow, transport habits and modal demand, captured at a street level.
In our next blog, we’ll discuss the existing transport data we’re in the process of integrating into the Urban Flows platform, so that we can start to understand what the best transport solutions might be to help make Sheffield a healthy, happy and productive city.
Author: Hadi Arbabi, Post-Doctoral Research Associate in Urban Digital Characterization at The University of Sheffield
Note: This piece is based on work previously written for Productivity Insights Network (PIN) which is will shortly be available on their website.
References:
[1] https://transportforthenorth.com/wp-content/uploads/A-report-on-the-Northern-Transport-Strategy-1.pdf
[2] https://www.gov.uk/government/news/new-trans-pennine-roads-study-announced
[3] https://www.economist.com/books-and-arts/2011/02/10/a-tale-of-many-cities
[4] https://www.sciencedaily.com/releases/2013/06/130620142925.htm
[5] https://doi.org/10.1080/00343404.2018.1490501
[6] https://doi.org/10.1080/17421772.2019.1569762